Flexible
Enable students and teachers to take in-person or online classes via mobile, aligned with the growth of e-learning in Brazil, which generated around R$ 10.3 billion in 2020.
Blapp is a complete platform that connects students and teachers in a practical and intuitive way. With the geolocation feature, users can quickly find the nearest teacher, choose the desired class, and decide whether the experience will be in-person or remote.
The entire process is integrated: from search and scheduling to secure in-app payments, ensuring convenience and reliability at every step.
Developed for people between 18 and 60 who value flexibility, Blapp transforms any moment into a learning opportunity. Thanks to geolocation and remote classes directly within the platform, users can learn during lunch breaks, at home, or after work — always with ease.
For teachers, the integrated payment system provides transparency and agility, while for students the key differentiator is an accessible, immersive, and personalized experience.
Objective 1
Enable students and teachers to take in-person or online classes via mobile, aligned with the growth of e-learning in Brazil, which generated around R$ 10.3 billion in 2020.
Objective 2
Provide a platform with fluid and agile communication between students and teachers, enhancing the learning experience through direct in-app interaction — a competitive differentiator validated during the discovery phase.
Objective 3
Create an environment where users can quickly find teachers specialized in the language they want to learn, addressing the growing demand for personalized learning in Brazil.
Objective 4
Develop an easy-to-use platform for everyone, regardless of social class, considering that 86% of the Brazilian population was already connected to the internet in 2020, creating the ideal foundation to democratize access to digital education.
Market research
Benchmarking
Interviews
Online questionnaire
Value proposition
User journey
Focus group
Brainstorming & co-creation
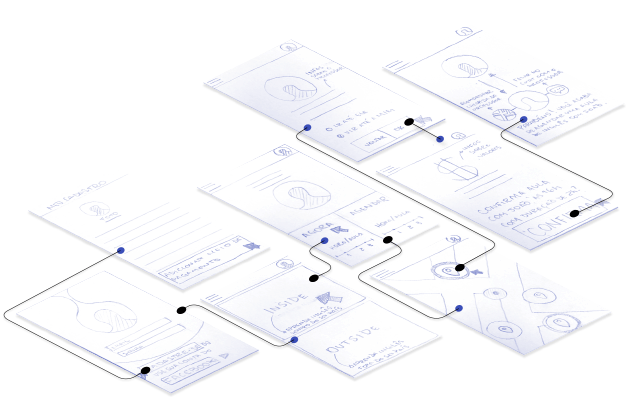
Flows & wireframes
Prototyping
Usability testing
Metrics validation
A/B testing
User & stakeholder feedback
- Total downloads: ~50,000 (iOS + Android)
- Monthly Active Users (MAU): 18,000
- Conversion rate (sign-up → first class): 22%
- Main channels: targeted ads (Google Ads + Meta), word-of-mouth, and partnerships with local schools
Impact: Geolocation-based campaigns increased CTR by 35%, reinforcing the importance of the app’s proximity feature.
- 30-day retention rate: 41%
- Average session length: 12 minutes
- Average classes per student/month: 2.3
- Active teachers: 1,200
Impact: By tracking retention through weekly cohorts, we identified that highly engaged teachers generated more student repurchases. This led to the creation of a teacher incentive program (e.g., featured placement in the app).
- Average ticket per class: R$ 65.00
- Total revenue transacted in year 1: R$ 1.2M
- Platform take rate: 20% (net revenue ~R$ 240k)
Impact: Funnel analysis (Google Analytics + Mixpanel) showed that simplifying the checkout process reduced cart abandonment by 18%, boosting conversion rates.
- Average NPS: 72
- Average teacher rating: 4.7/5
- Repurchase rate: 46% of students returned to book new classes
Impact: Through in-app surveys and interviews, we learned that flexibility (in-person or remote classes) was the main differentiator. This insight reinforced the decision to invest in improving the mobile video class experience.
1. Google Analytics + Firebase: monitoring acquisition, funnel, and retention
2. Mixpanel: in-app event analysis and usage cohorts
3. Satisfaction surveys (NPS + CSAT): conducted quarterly
4. Interviews & focus groups: qualitative insights from teachers and students
5. Internal dashboards (Looker): real-time tracking of revenue and key metrics

Offline Website Builder
2025. Developed by Jeff Gomes